




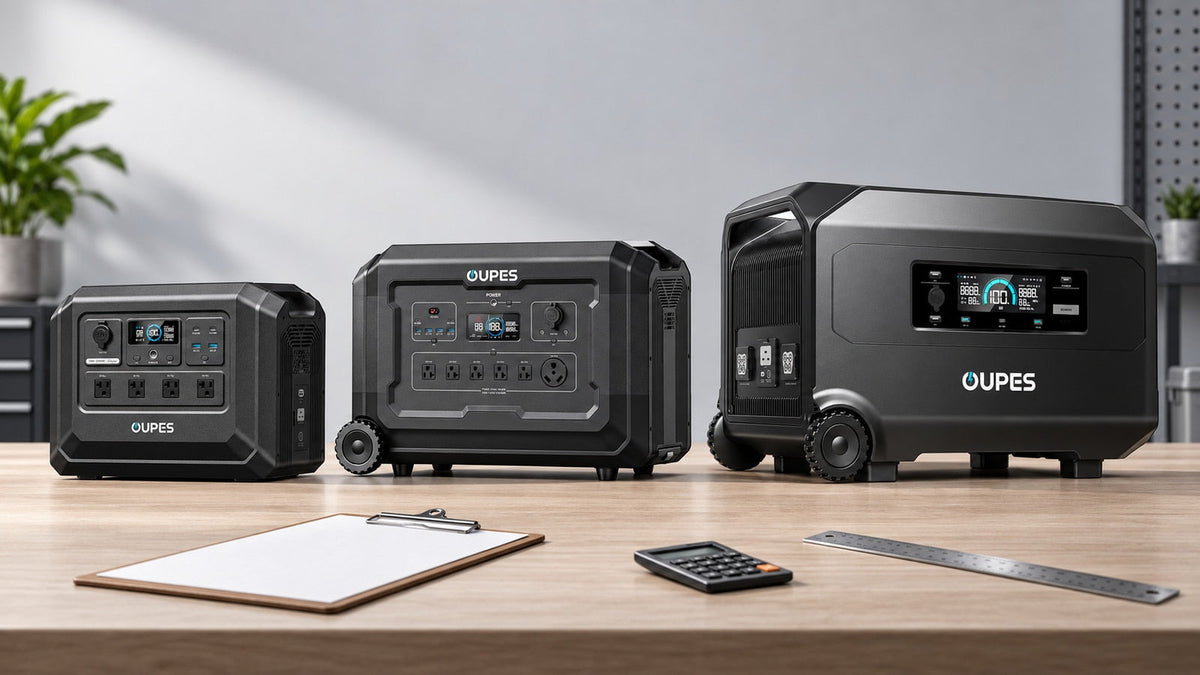
A fair portable power station chart compares the same type of value in every column: base-unit capacity, continuous output, stated surge behavior, AC voltage, charging limits, expansion range, weight, included items and a price captured on the same date. It also separates verified specifications from calculated estimates. The chart should help a buyer eliminate incompatible options before features and promotions influence the decision.
Key Takeaways
- Lock the use case and exact configuration before collecting numbers.
- Keep continuous watts, surge watts and boost modes in separate fields.
- List solar input voltage and current limits, not panel watts alone.
- Date prices and availability because promotions change faster than hardware specifications.
- Show assumptions beside every runtime or solar-yield calculation.
Define the Use Case and Configuration First
Start with a sentence that describes the job: “power a measured refrigerator, router and lights for 12 hours,” or “support a 120V RV load with solar recharging.” That statement determines which specifications matter. A camping buyer may prioritize carried weight and panel setup time, while a home-backup buyer may care more about expansion, transfer options and 240V capability.
Record the exact item compared. A base station, a station-plus-panel bundle and a station-plus-expansion-battery package are different configurations. Use the base battery capacity and base weight in the main chart unless every row includes the same category of accessories. Add a separate “tested or quoted configuration” column when bundles are the point of the comparison.
Do not mix a discontinued page, a marketplace listing and a current manufacturer page without flagging the difference. For a purchase-oriented chart, current official U.S. product pages should be the primary specification source. Add “checked on” and “source URL” columns so the chart can be audited later.
Use Columns That Answer Compatibility, Runtime and Ownership Questions
| Field | What to record | Why it matters |
|---|---|---|
| Battery capacity | Base rated Wh; expansion minimum and maximum separately | Prevents an expanded maximum from looking like base capacity |
| AC output | Continuous watts, surge watts and boost mode in separate cells | Prevents a temporary number from being compared with continuous output |
| AC system | 120V or 120/240V, outlet types and per-outlet limits | Determines appliance and installation compatibility |
| Charging | AC input, solar watts, PV voltage range, current limit and combined maximum | Shows whether the planned array and recharge window fit |
| Battery and service | Chemistry, cycle test basis, warranty terms and support region | Provides ownership context without reducing durability to one claim |
| Physical details | Base weight, dimensions and carried bundle weight | Distinguishes movable home backup from practical portability |
| Commercial status | Exact variant, included items, availability, price and date | Stops a temporary code or unavailable bundle from distorting value |
Add ports only when they influence the use case. Count USB-C ports by their individual power and supported role rather than counting all USB receptacles as equal. For home backup, include whether compatible expansion batteries exist and whether the product explicitly supports the intended building connection.
Normalize Calculations Without Presenting Them as Specifications
Runtime estimates should use the same load, loss allowance and reserve across every row. For example:
Estimated runtime = rated capacity × 0.85 ÷ average load.
At a constant 200W load, a 1,024Wh model yields 4.35 hours under the illustrative 85% factor; a 2,048Wh model yields 8.70 hours. These are planning calculations, not measured product runtimes. Real results vary with load, inverter idle consumption, battery condition, temperature and low-battery controls.
Apply the same discipline to solar. If a station accepts 800W of solar, that is an input ceiling, not a daily energy promise. Keep array nameplate watts, the station's electrical limits and estimated daily harvest in separate fields. Record every assumption, including peak-sun hours and the harvest factor.
Do not create a single “charging time” number from maximum input alone. Charging curves may reduce power near full charge, and the maximum may require a particular AC setting, solar array or combination. If you cannot verify identical test conditions, list the official input ratings and explain the limitation.
Example: Compare Four Current OUPES Home-Backup Classes
The table below uses official U.S. product pages checked September 18, 2026. It compares base units, excludes temporary prices and keeps special output modes separate from rated AC output.
| Model | Base capacity | Rated AC output | Surge or boost | Expansion statement | Best first fit |
|---|---|---|---|---|---|
| Mega 1 Lite | 1,024Wh | 2,000W | 4,500W surge | Check the selected configuration for compatible expansion options | Compact essential-load plan |
| Mega 2 Pro | 2,048Wh | 2,500W | 3,600W boost specification | Up to 10.24kWh with four compatible B2 batteries | Broader home essentials and longer runtime |
| Mega 3 | 3,072Wh | 3,600W | 7,000W surge | Up to 15.36kWh with compatible batteries | Higher-output managed backup |
| Guardian 6000 V2 | 4,608Wh | 6,000W at 240V; 3,600W at 120V | 7,200W boost specification | 4.6–41.4kWh stated system range | Larger 120/240V home-backup planning |
The final column is editorial guidance, not an electrical compatibility guarantee. Compare models in the OUPES Mega series and the broader home backup collection, then verify the precise outlets, cables and installation requirements for the intended loads.

OUPES Mega 1 Lite
- 1,024Wh base capacity.
- 2,000W rated AC output.
- Up to 800W solar input.
- A useful baseline for compact home-backup comparisons.

OUPES Mega 3
- 3,072Wh base capacity.
- 3,600W rated AC output.
- 7,000W surge specification.
- Expandable system for larger managed loads.

OUPES Guardian 6000 V2
- 4,608Wh base capacity.
- 6,000W 240V dual-voltage output specification.
- Up to 3,600W solar input through dual MPPT inputs.
- Expandable 4.6–41.4kWh system range.
Score Only the Requirements That Matter to the Buyer
A weighted score can help after incompatible products are removed. Give “pass/fail” status to hard requirements such as voltage, startup capability and minimum energy. Then weight preferences such as portability, expansion, number of USB-C ports and app control. A model that fails a required 240V load should not win because it is light or inexpensive.
Use a clear scale. For example, award 0 when a feature is absent, 1 when it meets the minimum and 2 when it provides useful margin. Multiply by the buyer's chosen weight. Keep the raw specifications visible beside the score so readers can disagree with the weights without losing the underlying evidence.
Price-per-Wh can be one field, but it should not be the headline verdict. It ignores inverter capability, charging, included accessories, service and whether the system fits the job. If you calculate it, use the same price type and date in every row.
Audit the Chart Before Publishing
- Check that every row uses the same market, voltage and base-or-bundle convention.
- Remove prices that cannot be reproduced in the selected cart configuration.
- Separate continuous, surge and boost values.
- Verify that expansion maximums include the number and type of batteries required.
- Check solar voltage and current limits, not only input watts.
- Label calculated runtime and daily harvest as estimates with assumptions.
- Open every source link and record the check date.
- Flag sold-out or preorder items instead of ranking them as normal immediate purchases.
Maintain the chart as a dated artifact. Hardware specifications may remain stable while availability, bundles and prices change. A transparent timestamp makes the chart useful even after a promotion ends.
Frequently Asked Questions
Should surge watts be placed beside continuous watts?
Yes, but in a separate column. A reader should never mistake a temporary surge figure for continuous output.
Is Wh per pound a fair portability metric?
It can help, but include the station, required panels and accessories when the actual task requires the full kit.
Can I compare advertised runtime claims directly?
Only when the load, settings and test conditions match. A normalized calculation is often clearer, provided its assumptions are shown.
How should promotional prices be handled?
Record the exact variant, code requirement, date and checkout status. Keep conditional prices separate from standard listed prices.
Does more AC outlets mean more output?
No. Multiple outlets usually share the inverter's total rating and may also have individual limits.
Should battery cycle life be one number?
Include the stated test endpoint and conditions when available. Cycle claims are not identical to a fixed calendar-life promise.
How do I compare solar charging fairly?
List input watts, permitted voltage and current, number of MPPT inputs and the array configuration needed to reach the stated maximum.
What is the most important chart column?
The pass/fail requirement tied to the intended load. Voltage, output or capacity can each be decisive depending on the job.


Leave a comment
This site is protected by hCaptcha and the hCaptcha Privacy Policy and Terms of Service apply.